I've been trying to follow on line instructions to create a worksheet (multiple pivot tables) from data that doesn't leave blank rows between the tables, and have not been successful. I tried using a data model, and attempted PowerPivot but still have not been successful, so I don't know if my thinking/following directions is faulty, or if Excel is the wrong tool.
Ideally the tables would display cleanly minimizing the space between data segments. If you look at the PivotTable tab, you'll notice that there's 30 blank lines between the fist two tables. I've uploaded sample data. The original has MANY more rows, and columns which I would normally use for slicers. Normally I can use a single slicer for multiple pivot tables, but since I've been trying to use the data model, that no longer works. Since I'm just trying to find a clean display, I don't want any calculations, and suppressed sub-totals on the pivot tables.
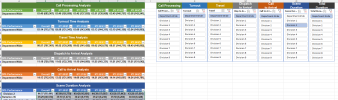
If you look at the Data tab, you can see where I filtered each table to display the Department-Wide data, and it is displays nice and clean, but imaging if you have 20 divisions with over 200 stations, and columns with cities, jurisdictions, districts, etc. to dissect the data. I know you can use slicers with tables, but each table requires their own slicer so that is unyielding.
Any assistance you can give would be greatly appreciated!
Traci
Ideally the tables would display cleanly minimizing the space between data segments. If you look at the PivotTable tab, you'll notice that there's 30 blank lines between the fist two tables. I've uploaded sample data. The original has MANY more rows, and columns which I would normally use for slicers. Normally I can use a single slicer for multiple pivot tables, but since I've been trying to use the data model, that no longer works. Since I'm just trying to find a clean display, I don't want any calculations, and suppressed sub-totals on the pivot tables.
If you look at the Data tab, you can see where I filtered each table to display the Department-Wide data, and it is displays nice and clean, but imaging if you have 20 divisions with over 200 stations, and columns with cities, jurisdictions, districts, etc. to dissect the data. I know you can use slicers with tables, but each table requires their own slicer so that is unyielding.
Any assistance you can give would be greatly appreciated!
Traci